This article provides a review of the study by
Chang, J., Wang, Y., and Xiong, W. (2025), Taming Cycles: China’s Growth Targets and Macroeconomic Management (NBER Working Paper No. 33718). Available at: https://www.nber.org/papers/w33718
The views and opinions expressed in this review are those of the author and do not necessarily reflect the official position of AERC. This material is intended for informational purposes only.
On April 14, 2026, Kazakhstan’s Prime Minister instructed the government to ensure sustained economic growth of above 5% through the end of the year – coming just after first-quarter data showed real GDP expanding by 3.0% (YoY). The objective itself is hardly unusual. Setting growth targets is a familiar feature of economic policymaking.
Yet the moment invites an unexpected association. It brings to mind a paper by Chang, Wang and Xiong (2025), ostensibly about a very different economy – China. Perhaps the link is merely coincidental: the paper, too, was published in April, a year earlier. Or perhaps it reflects a certain sense of déjà vu.
At first glance, the paper does little to draw attention. Its academic and rather restrained title – Taming Cycles: China’s Growth Targets and Macroeconomic Management – suggests a conventional analysis of stabilization policy. There is little in it to hint at broader parallels, let alone ones extending to Kazakhstan. But beneath this neutral framing lies a far more provocative argument. Chang, Wang and Xiong are less concerned with the effectiveness of China’s policies than with the reliability of the statistical foundation on which they are assessed. The question, in other words, is not simply how well China smooths its business cycles, but to what extent the reported GDP figures themselves reflect underlying economic reality.
Chang, Wang and Xiong (2025) open with what appears to be a routine episode. On September 24, 2024, China’s Politburo held its regular monthly meeting and, despite clear signs of economic slowdown, reiterated the need to achieve the annual growth target of 5% (Any resemblance to the opening of this column is, of course, entirely coincidental).
The sense of urgency was reinforced by a coordinated stimulus programme unveiled almost immediately thereafter. China’s key economic institutions – the Ministry of Finance, the People’s Bank of China and the National Development and Reform Commission – rolled out a broad set of policy measures, ranging from monetary easing to expanded fiscal support.
The sequence that followed is telling. By December 9, 2024 – less than three months later – the Politburo was already expressing confidence that the 5% growth target for the year would be met. Looking ahead, the same benchmark was reaffirmed for 2025 without hesitation. As we now know, that target, too, was duly achieved.
Having set the scene, the authors turn to the mechanism underlying these developments. In China, they argue, growth targets exhibit a persistent form of “top-down amplification”. In simple terms, if the central government sets a target of 5%, provincial authorities tend to raise the bar – say, to 6% –with prefecture-level governments pushing it higher still. Using data from 2004 to 2022, the authors show that national GDP growth targets were systematically exceeded by those set at the provincial level, which were in turn surpassed by targets at the level of prefecture cities, and so on down the administrative hierarchy. This process is marked by a notable asymmetry. When external conditions are favorable, growth targets are revised upwards quickly. When the outlook deteriorates, however, they prove far more resistant to downward adjustment.
As the authors argue, the relentless pursuit of growth targets has tangible consequences. First, it leads to greater government intervention in the economy and rising public spending. During 2011–2019, overly ambitious targets are estimated to have added local government debt equivalent to 14% of GDP.
At the same time, as administrative intervention intensifies, GDP gradually loses its properties as a neutral economic indicator. Its relationship with underlying economic fundamentals – such as corporate revenues and household demand – begins to weaken.
The numbers are striking. In 2002–2008, a 1% increase in China’s GDP was associated with a 0.895% rise in consumption. By 2011–2019, the same 1% increase corresponded to just a 0.06% increase in consumption—and the relationship was no longer statistically significant. In effect, the link between headline growth and consumer welfare had largely broken down.
A similar pattern emerges for corporate performance. Before 2008, a 1% increase in GDP was associated with a 1.77% rise in corporate revenues. After 2008, the relationship turns negative: a 1% increase in GDP coincides with a 0.065% decline in revenues. Growth, it seems, was no longer reliably reflected in business outcomes.
Unsurprisingly, this dynamic has fueled growing skepticism towards official statistics. When China reported GDP growth of exactly 5.0% for 2024 – precisely matching the official target – the reaction was immediate. Critics questioned the credibility of the figures, pointing to their misalignment with other indicators, particularly the much weaker performance of consumption.
In that sense, GDP in China has increasingly come to resemble not just an economic indicator, but a performance metric – one that reflects the effort to meet targets as much as the state of the economy itself.
This raises a natural question: is China unique in this respect?
In his 2023 address to the nation, Kazakhstan’s leadership set an ambitious goal: to double nominal GDP by 2029. Translated into macroeconomic terms, this implies sustaining annual real GDP growth of no less than 5%. Since then, the figure of 5% has taken on a life of its own in the country’s economic policy discourse. The logic behind it is familiar: a target is set from the top, and gradually becomes an anchor for policymaking.
The more interesting question, however, lies elsewhere. To what extent does GDP, in this setting, still reflects underlying economic dynamics – rather than outcomes shaped by the target itself?
One way to approach this is to look at the data. Not through elaborate modelling, but at a more basic level – by examining simple correlations between GDP growth and a range of key indicators, while keeping in mind an obvious caveat: correlation reflects association, not causation. For all their limitations, such correlations can still offer useful food for thought.
To interpret the strength of these relationships, the following classification of correlation coefficients (the Chaddock scale) is used:
|
Interpretation |
|
|
0.0-0.1 |
No relationship |
|
|
0.1-0.3 |
Weak relationship |
|
|
0.3-0.5 |
Moderate relationship |
|
|
0.5-0.7 |
Moderately strong relationship |
|
|
0.7-0.9 |
Strong relationship |
|
|
0.9-1.0 |
Very strong relationship |
A good starting point is the composition of Kazakhstan’s GDP by expenditure. Since household final consumption accounts for the largest share, it is hardly surprising that real GDP growth moves closely in step with household spending. The data bear this out: over 2007–2025, the correlation between real GDP growth and growth in household consumption reaches 0.88. In other words, given the structure of GDP itself, this synchronization says more about its arithmetic than about any meaningful link between GDP and the actual well-being of households.
A more revealing comparison is between real GDP growth and real household incomes. This relationship speaks more directly to whether economic growth translates into higher living standards.
Here, the picture becomes less straightforward. Over 2010–2025, the correlation between real GDP growth and growth in real household incomes stands at just 0.29 – indicating a weak relationship. That said, a closer look at the data suggests that this relationship has not been stable over time (see Figure 1). At least until 2019, GDP and household incomes appear to move broadly in tandem.
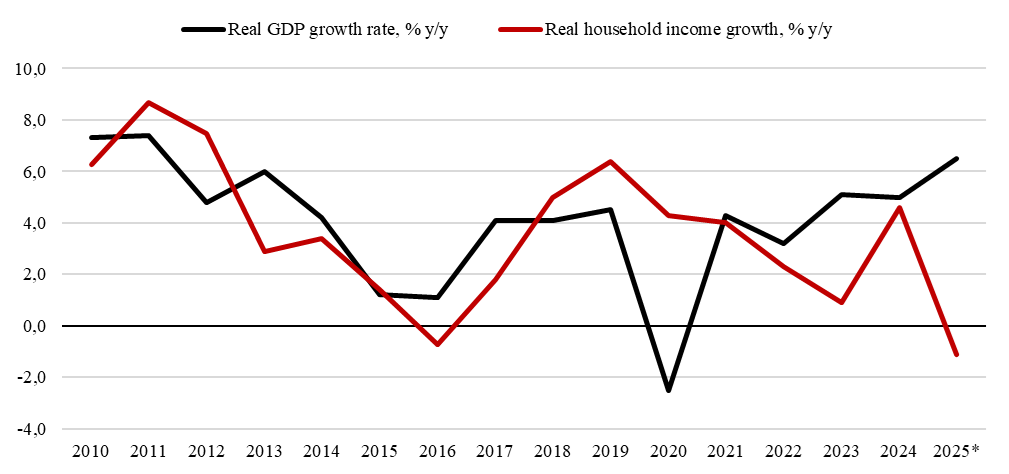
Figure 1. Real GDP growth and real household income growth, % y/y
Source: BNS ASPR RK
But this is where the story takes a turn. Once the sample is split, the relationship changes markedly.
Table 1. Correlation between real GDP growth and real household income growth, by period
|
|
2010-2025 |
2010-2019 |
2020-2025 |
|
Correlation |
0.2899 |
0.7719 |
-0.5509 |
The period breakdown makes the shift particularly clear (see Table 1). In 2010–2019, the correlation between economic growth and real household incomes remained strong (0.77). In 2020–2025, however, it turns negative (-0.55). In other words, in recent years GDP growth has increasingly coincided with declining real incomes. Under such conditions, GDP ceases to function as a reliable indicator of changes in household well-being – at least as measured by real monetary incomes.
Further insight comes from comparing household incomes and spending in the national accounts. The absence of a stable positive relationship between real incomes and consumption suggests that household spending is increasingly sustained through borrowing and the drawdown of savings. Figure 2 below compares disposable income with household expenditure: a ratio below one indicates that spending exceeds income.
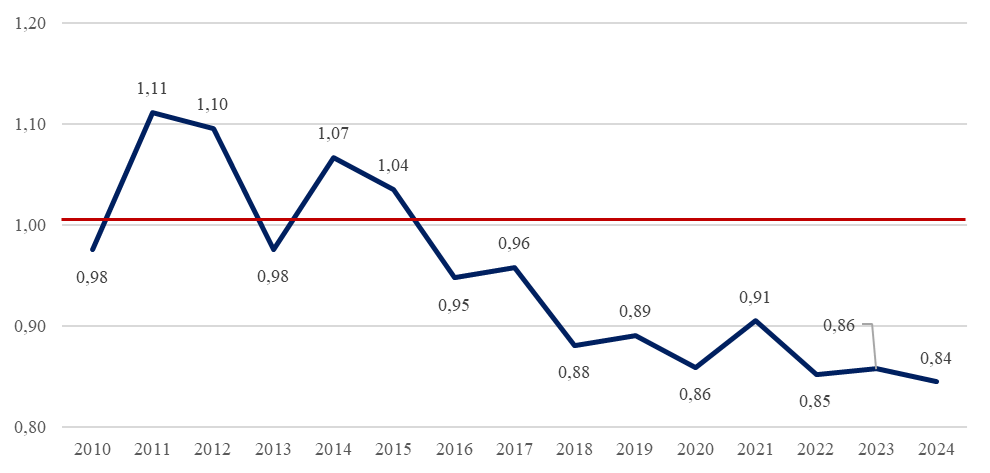
Figure 2. Ratio of gross household disposable income to final consumption expenditure
(Values above 1 indicate that income exceeds spending; values below 1 indicate that spending exceeds income.)
Source: calculations by Mukhtaruly A. based on national accounts data from BNS ASPR RK
It is also instructive to look at how GDP relates to corporate indicators – most notably, the profitability of large and medium-sized enterprises. According to data from BNS ASPR RK, profitability was negative only once over 2007–2025, in 2015. Otherwise, it has followed a relatively stable trajectory, broadly in line with the dynamics of GDP (see Figure 3).
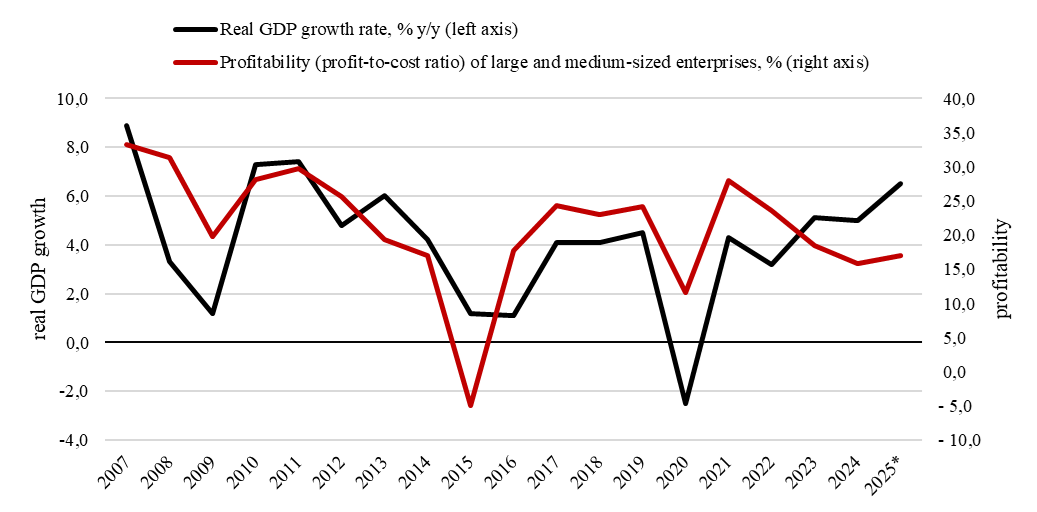
Figure 3. Profitability of large and medium-sized enterprises in Kazakhstan, %
Source: BNS ASPR RK
The correlation analysis reinforces this point. Over the period in question, the relationship between real GDP growth and corporate profitability stands at 0.57 – noticeably stronger than its link with household incomes.
In that sense, Kazakhstan’s GDP today appears to track the performance of the corporate sector more closely than it does changes in household well-being.
Putting the pieces together yields a simple, if somewhat uncomfortable, conclusion. In Kazakhstan today, GDP appears to track the dynamics of the corporate sector more closely than changes in household well-being. Its link with real incomes has weakened in recent years - and in some periods, even turned negative.
In that sense, Kazakhstan’s recent experience echoes the patterns documented by Chang, Wang and Xiong (2025). As in China, growth targets may be playing a more active role than is often assumed.
This raises a broader question. If the growth target becomes the anchor of economic policy, to what extent does GDP remain a neutral indicator of economic conditions? And is there a gradual shift underway – where, instead of measuring reality, the headline figure increasingly reflects the effort to meet a pre-set target?
There is unlikely to be a definitive answer. Yet even a simple reading of the data suggests a need for caution. Interpreting GDP growth, it seems, is becoming less straightforward than it once appeared.